

Grofit
Platform
GoFit is an AgTech company that provides farmers with field insights through a network of sensors. Moblers built Grofit Console for them — an advanced web application that aggregates data from IoT devices in the field and presents it clearly and in an actionable way.
The platform brings together telemetry from distributed hardware into one console: farmers and agronomists can monitor conditions, compare devices over time, and manage the underlying infrastructure without switching tools.
Moblers designed and developed Grofit Console as a scalable web product — combining real-time data pipelines, intuitive dashboards, and admin workflows tailored to GoFit’s sensor ecosystem and customer organizations.
Services
Reports & charts
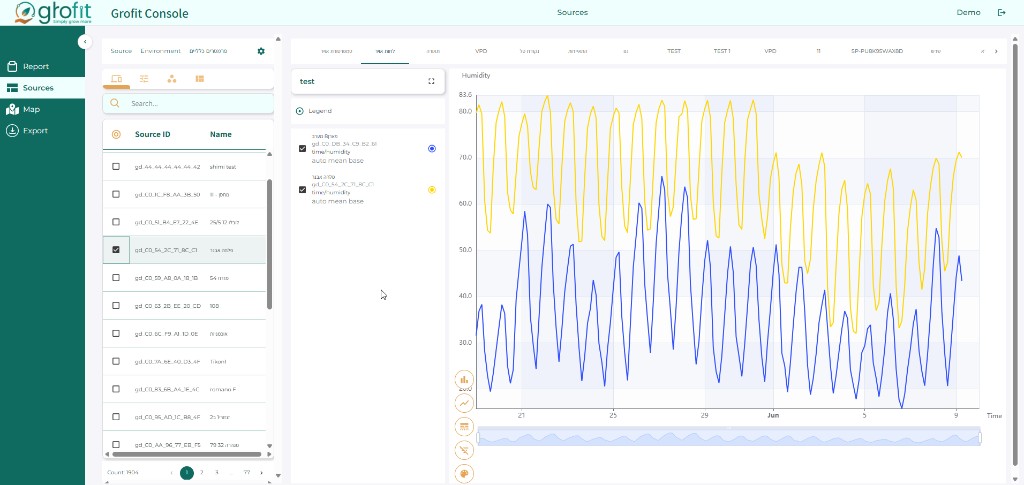
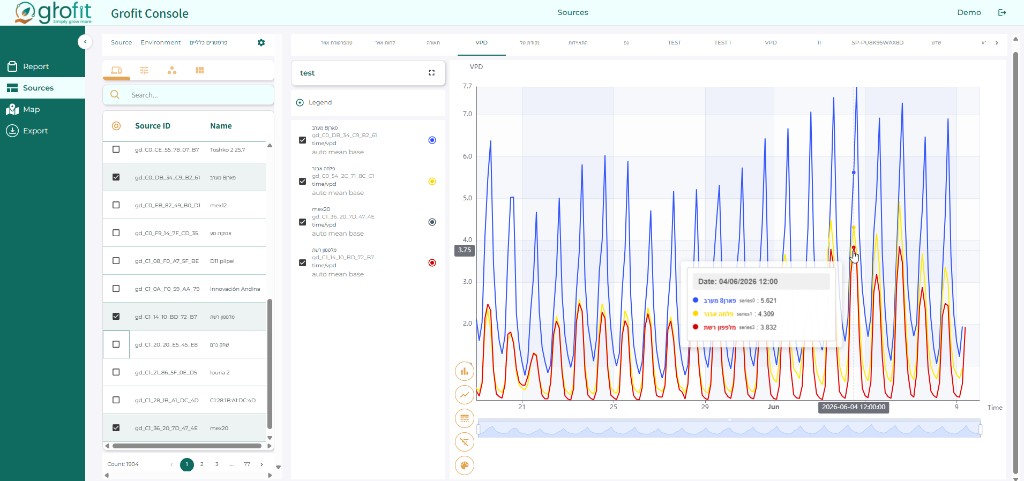
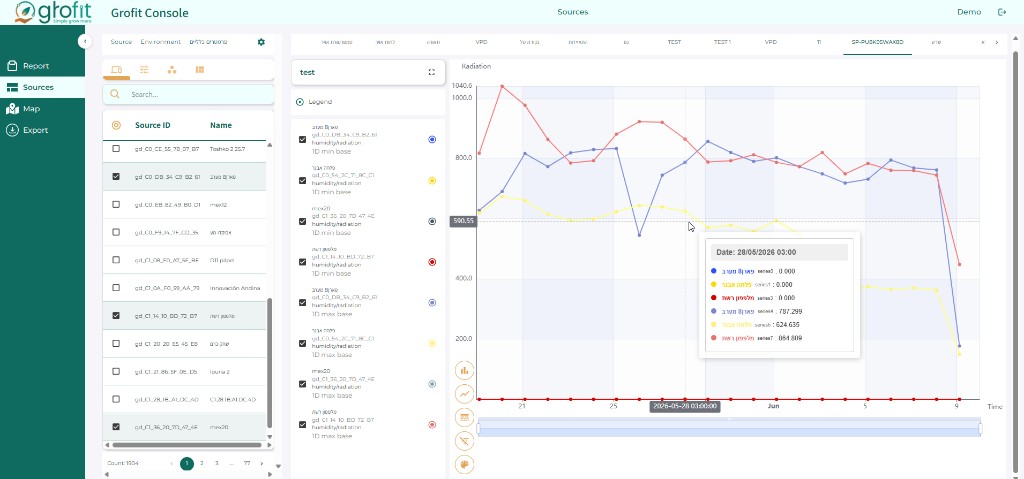
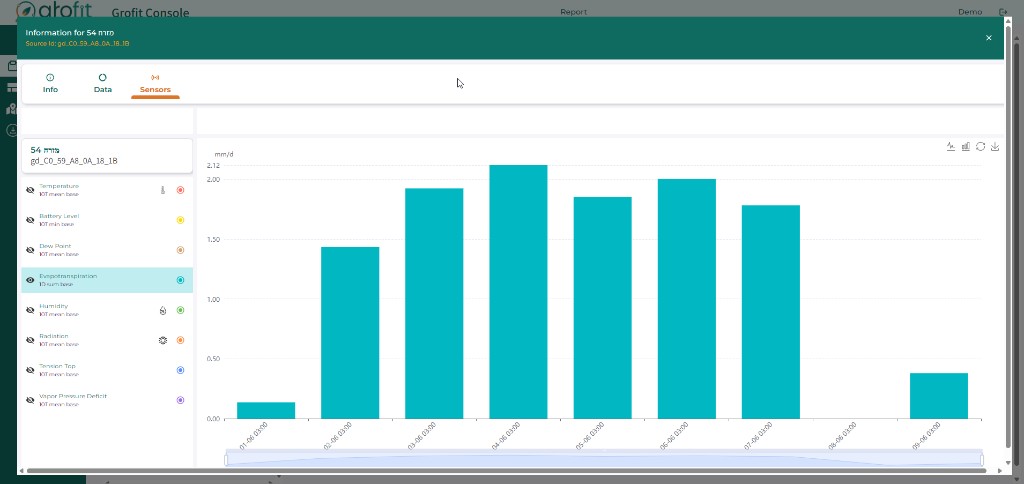
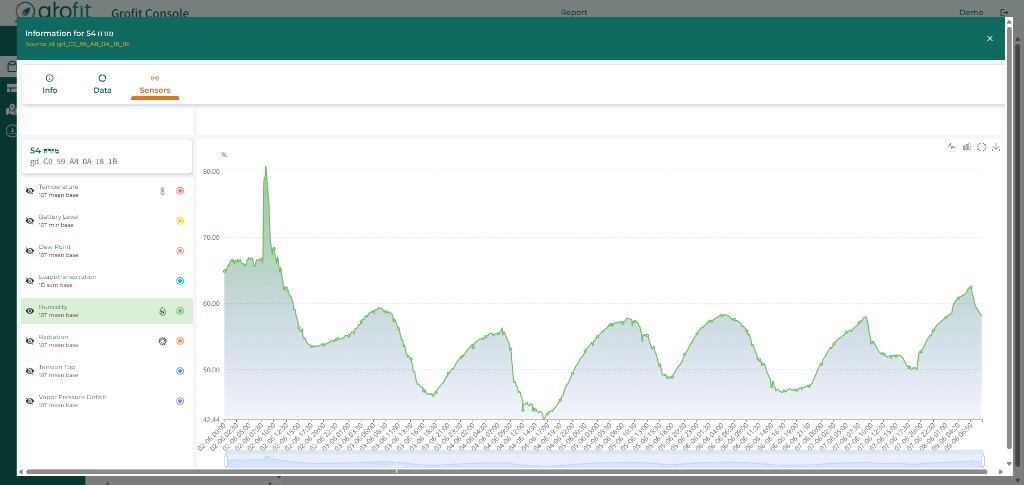
Track metrics such as temperature, humidity, soil tension, EC, evaporation, and more — with date-range selection and side-by-side comparison between devices.
Interactive map
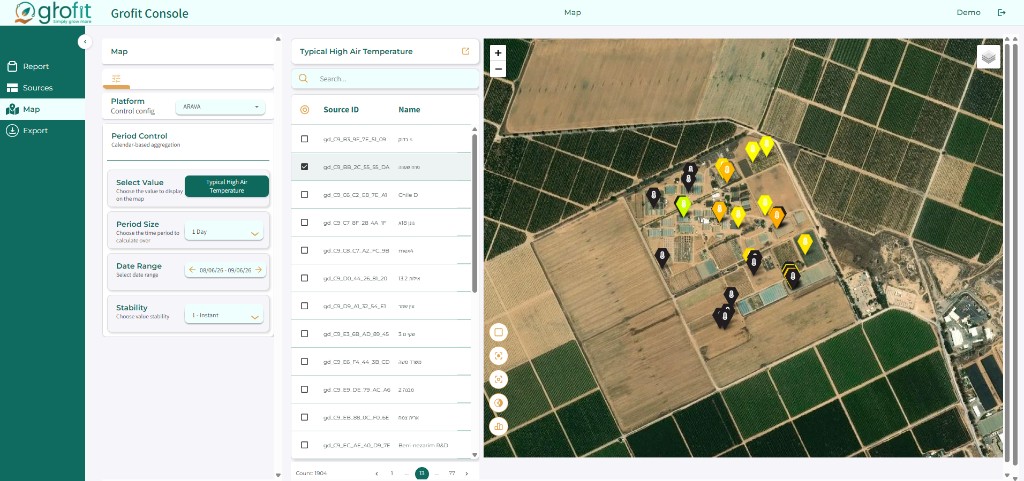
View sensor locations overlaid on agricultural plots for quick spatial context in the field.
Infrastructure management (Admin)
Manage organizations, plots with geographic boundaries, and logical devices with clear naming and hardware replacement history.
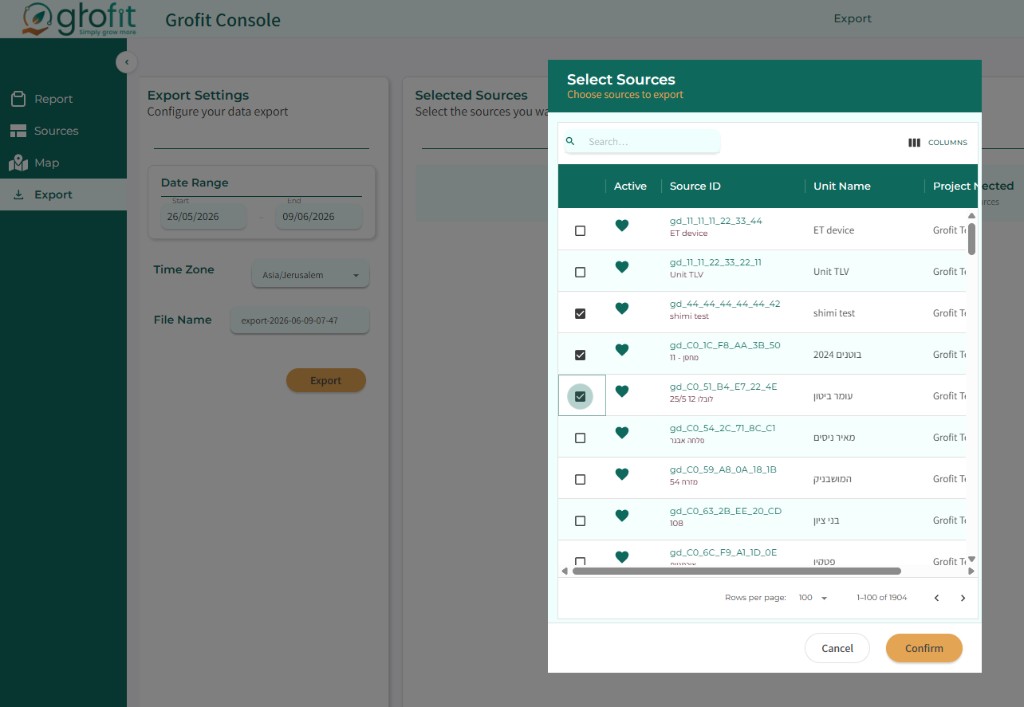
Data export
Export datasets for further analysis or external reporting.
The challenge
GoFit needed a unified console for a growing network of field sensors — turning raw IoT telemetry into insights farmers could trust and act on.
Key challenges included:
Multi-metric visualization: Presenting diverse agronomic readings (temperature, humidity, soil tension, EC, evaporation, and more) in charts that remain readable across date ranges and device comparisons.
Spatial context: Mapping sensors to real agricultural plots so users could orient data to physical locations in the field.
Operational scale: Supporting organizations, bounded plots, logical devices, and hardware swap history — admin tooling that stays accurate as deployments grow.
Data portability: Enabling export for agronomists and analysts who need to continue work outside the platform.
The solution
Moblers delivered Grofit Console — a web platform that centralizes GoFit’s field data with dashboards, maps, and admin tools built for day-to-day agricultural operations.
The application gives GoFit’s customers a single source of truth for sensor telemetry, plot-level context, and infrastructure management — with export paths for deeper analysis and reporting.
By combining IoT integration, clear UX, and robust admin workflows, Grofit Console helps GoFit turn sensor networks into actionable field intelligence for farmers.
Technical architecture
High-level architecture from the published product description (not a named production stack):
Field sensors / IoT devices
        │  telemetry (protocol not public)
        ▼
┌──────────── ingestion & real-time pipelines ────────────┐
│ Collect, normalize, and surface multi-metric readings   │
│ for near-live dashboards (broker/runtime not public)    │
└──────────────────────────┬──────────────────────────────┘
                           │
                           ▼
┌──── telemetry store     metadata (orgs, plots, devices) ┐
│ Time-series / history   │  replacement history          │
│ (engine not public)     │  (store not public)           │
└────────────┬────────────┴──────────────┬────────────────┘
             │ backend / API layer       │
             ▼                           ▼
     Grofit Console (web)         Export for analysis
     charts, map, admin           (formats not public)
Ingestion. Distributed field hardware streams agronomic telemetry into GoFit’s backend. Device protocols, gateways, payload formats, and whether ingest is MQTT, polling, batch upload, or another path are not publicly disclosed.
Real-time pipelines. The published product combines real-time data pipelines with live sensor metrics in the console. Typical ingest frequency per device, end-to-end latency (average/p99), streaming versus batch, downsampling versus raw storage, and reconnect/replay behavior during connectivity loss are not publicly disclosed.
Storage. Charts, date-range comparison, plot maps, organizations, logical devices, and hardware replacement history imply separate concerns for multi-metric telemetry and infrastructure metadata. Time-series engines, warehouses, retention, and archival policies are not publicly disclosed.
Backend and frontend. A browser-based dashboard serves reports, interactive maps, admin workflows, and export. Frontend framework (React, Angular, Vue, or other), backend language/runtime, API style (REST, GraphQL, or other), and identity/authentication product are not publicly disclosed.
Hosting, CI/CD, and observability. Cloud provider, containers/orchestration, CI/CD tooling, monitoring, and logging stacks are not publicly disclosed.
Do not treat example product names (Kafka, MQTT, PostgreSQL, Kubernetes, and similar) as Grofit production choices.
Supported features and integration summary
Confirmed product behavior:
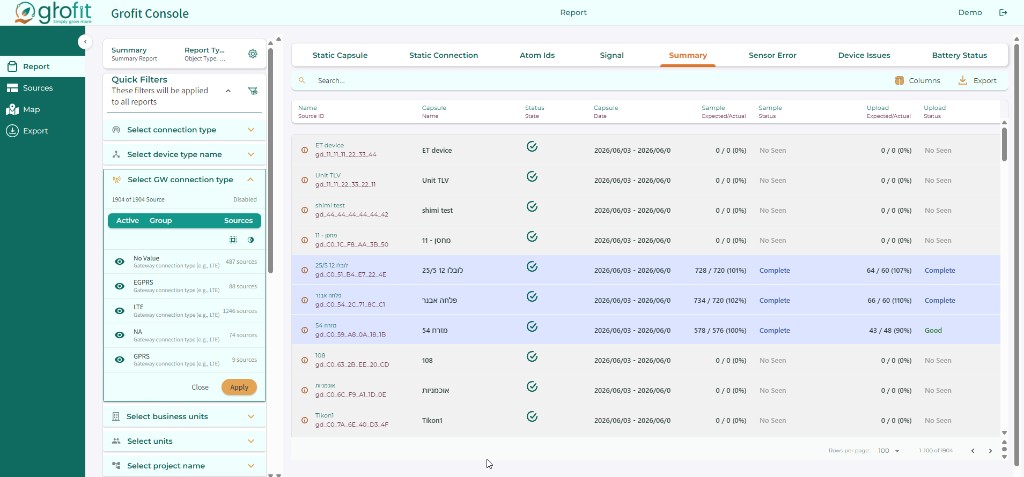
- Browser-based console for reports, multi-metric charts, date-range and side-by-side device comparison.
- Field telemetry aggregation through real-time data pipelines.
- Interactive sensor map over agricultural plots.
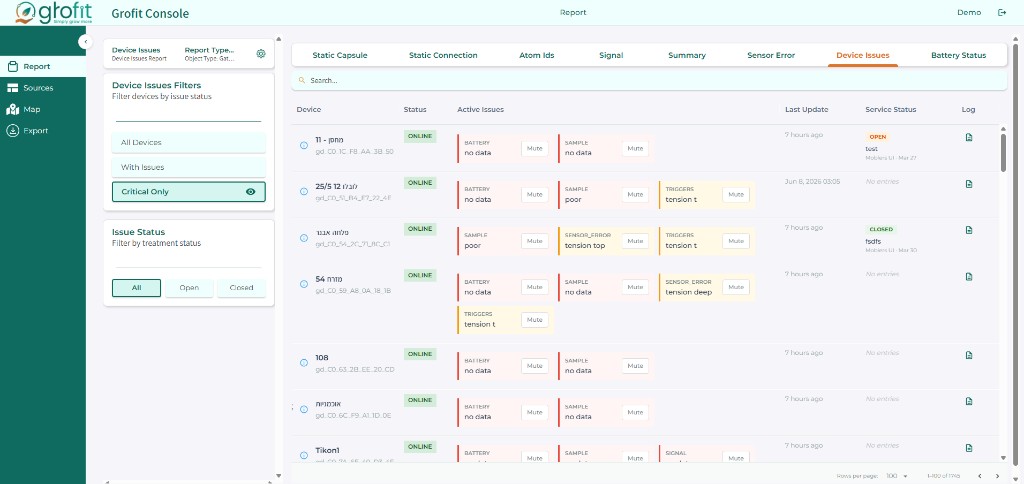
- Admin workflows for organizations, geographically bounded plots, logical devices, and hardware replacement history.
- Dataset export for downstream analysis or reporting.
Confirmed integration boundary: Grofit Console connects GoFit’s distributed field-sensor ecosystem to a central web product. Device protocols, gateway patterns, payload formats, administrative API types, authentication, GIS providers, and third-party analytics integrations are withheld because they are not publicly documented.
Moblers services and scope
Published deliverables and responsibilities:
- Product design and UX for dashboards, chart interactions, map context, and admin workflows.
- Full-stack engineering of the Grofit Console web application.
- IoT integration and real-time data pipelines that aggregate field telemetry.
- Reports and charts for temperature, humidity, soil tension, EC, evaporation, and additional agronomic metrics, with date-range selection and side-by-side device comparison.
- Interactive map of sensor locations overlaid on agricultural plots.
- Admin infrastructure: organizations, plots with geographic boundaries, logical devices with clear naming, and hardware replacement history.
- Data-export paths for further analysis or external reporting.
Published team description: full-stack engineers, UI/UX, and IoT integration specialists.
Not publicly disclosed: project start/end dates, sprint cadence, FTE by role, named design artifacts (research, wireframes, design system), ownership split versus GoFit, QA/DevOps headcount, handover runbooks, and post-launch maintenance or SLA terms.
Operational scale and device lifecycle
Published behavior for growing deployments:
- Organizations as customer tenants for admin work.
- Plots with geographic boundaries for spatial context.
- Logical devices with clear naming, distinct from physical hardware.
- Hardware replacement history so device identity can persist when sensors are swapped.
Not publicly disclosed: replacement-record fields (timestamp, operator, serials, reason, notes), whether history is immutable or versioned, role-based access controls, organization/plot limits, GeoJSON/KML or other geometry import, bulk CSV import/export, administrative APIs, naming conventions, and retention of historical device mappings.
Administrative and bulk operations
Published admin surfaces cover organizations, plots, logical devices, clear device naming, geographic boundaries, and hardware replacement history.
The public material does not establish that Grofit Console exposes an administrative API, bulk CSV workflows, GeoJSON/KML import, a particular RBAC model, or numeric tenant quotas. Endpoint patterns, permission scopes, bulk-operation limits, canonical replacement-history fields, and whether replacement events are immutable or versioned require GoFit approval before publication.
Data export
Published capability: export datasets for further analysis or external reporting.
Not publicly disclosed: CSV, JSON, XLSX, Parquet, or other formats; whether export is UI-only or also an authenticated API; inclusion of device and plot metadata; row, date-range, or file-size limits; compression; scheduled/automated exports or webhooks; BI or warehouse connectors; and retention of exported files or of the underlying telemetry.
Results and impact
Confirmed qualitative outcomes from the shipped product:
- A single console for farmers and agronomists instead of switching tools.
- Actionable field views from live multi-metric charts, date-range and device comparison, and plot maps.
- Admin records that stay usable as organizations, plots, and hardware change, including replacement history.
- Export paths so analysis can continue outside the platform.
Requested numeric outcomes that are not publicly disclosed (no public baseline, cohort, or measurement window):
- Active sensor count, messages/day, GB/day, or retention volume.
- End-to-end latency from sensor to dashboard.
- Active agronomists/farmers, DAU/WAU, organizations/farms using the console, or sensor reporting adoption rate.
- Time-to-insight, hardware downtime, MTBF/uptime, hours saved per reporting task, or revenue/retention impact.
- Export usage and availability/uptime SLA.
Conservative metrics can be published when GoFit approves the figure, cohort, and measurement period.
Architecture caveats
- The diagram uses generic component names. It is not GoFit’s production topology.
- “Real-time” and “live sensor metrics” describe published product behavior, not a measured latency SLA.
- No unnamed framework, broker, database, cloud, GIS vendor, or SLA should be attributed to Grofit Console without written approval.
Grofit Console FAQ
What technical architecture or technologies underpin the platform? Grofit Console is a browser-based web platform that aggregates field IoT telemetry through real-time data pipelines into dashboards, maps, and admin workflows. Named frameworks, databases, brokers, cloud providers, CI/CD, and observability tools are not publicly disclosed.
What measurable outcomes did the project achieve? Public materials describe qualitative impact: a single console for live agronomic metrics, device comparison, plot maps, infrastructure administration including hardware replacement history, and dataset export. Numeric KPIs are not publicly disclosed.
What services did moblers provide? Design and development of Grofit Console, including UI/UX, full-stack engineering, IoT integration, real-time pipelines, charts, maps, admin tooling, and data export. Calendar dates, FTE allocation, and post-launch SLA terms are not publicly disclosed.
How does the platform support operational scale and device lifecycle? Admin tooling manages organizations, geographically bounded plots, and logical devices with naming and hardware replacement history. Replacement-record fields, RBAC, geometry import, bulk APIs, and retention policies are not publicly disclosed.
What data export formats, limits, or integration paths are available? The console can export datasets for further analysis or external reporting. Formats, API access, size limits, scheduling, and warehouse connectors are not publicly disclosed.
Frequently asked questions
What technical architecture or technologies underpin the platform?
Grofit Console is a browser-based web platform that aggregates field IoT telemetry through real-time data pipelines into dashboards, maps, and admin workflows. Logical layers include ingestion from distributed sensors, processing/normalization, storage of telemetry and infrastructure metadata, backend services for charts, maps, admin, and export, and the web console. Named frameworks, databases, brokers, cloud providers, CI/CD, and observability tools are not publicly disclosed.
What measurable outcomes or KPIs are published for usage, latency, data volumes, and adoption?
Public materials describe qualitative impact: a single console for live agronomic metrics, device comparison over time, plot maps, organization and device administration including hardware replacement history, and dataset export. Device counts, latency, uptime, adoption, revenue, and other numeric KPIs are not publicly disclosed.
What services did moblers provide?
moblers designed and developed Grofit Console as a scalable web product. Published scope includes UI/UX, full-stack engineering, IoT integration, real-time data pipelines, reports and charts, an interactive sensor map, admin tooling for organizations, plots, and logical devices, and data export. Calendar dates, FTE allocation, and post-launch SLA terms are not publicly disclosed.
How does the platform support operational scale and device lifecycle?
Admin tooling manages organizations, plots with geographic boundaries, and logical devices with clear naming and hardware replacement history so records stay accurate as deployments grow. Replacement-record fields, RBAC, geometry import formats, bulk APIs, and retention policies are not publicly disclosed.
What data export formats, limits, or integration paths are available?
The console can export datasets for further analysis or external reporting. File formats, UI-versus-API access, size or date-range limits, scheduling, warehouse connectors, and retention of exported files are not publicly disclosed.
More projects
More projects that may interest you
My Partner
Self‑Service Mobile Application for Orange
Account management, roaming plans, SIM activation, technician scheduling, secure login

Baccara
Android mobile app (Flutter)
Device setup, advanced control parameters, real-time monitoring, NFC hardware integration

Cyberbit
Web‑based Licensing Generator
License generation for Cyberbit’s cybersecurity products